GNetWatch is
licensed under GPLv2.
The
directory 3rdParty in each
bundle distribution contains third-party licences.
1.3. Advanced protocols support
Note that IPv6 and SNMPv3 are fully supported by GNetWatch.
GNetWatch is
being developed in Java with Eclipse, following the Unified Software
Development Process.
1.4. Graphic performances
Graphic
performances have been particularly optimized: GNetWatch is using both SWT and
AWT simultaneously, the main GUI is drawn with SWT in order to get direct
access to the underlying windowing system and animated graphs are generated
using Java2D over AWT.
1.5. Supported platforms
GNetWatch
depends on class libraries available in Sun’s JRE 5 specification and on the
following external packages:
·
hibernate-3.1
·
commons-collections-3.2
·
commons-configuration-1.3
·
commons-io-1.2
·
commons-jxpath-1.2
·
commons-lang-2.3
·
commons-logging-1.1
·
dom4j-1.6.1
·
log4j-1.2.13
·
hsqldb
·
snmp4j
·
swt
These
packages are independent from the target platform, except for SWT, the Standard
Widget Toolkit (http://www.eclipse.org/swt)
that comes with native libraries compiled specifically for your target
platform. This is the main reason why different distributions, named bundles, are
available.
Moreover, GNetWatch
makes use of the browser widget included in SWT. This widget depends on
external packages like Mozilla or Internet Explorer, on some operating systems.
At least, GNetWatch
should run on the platforms on which the SWT browser widget runs:
·
Windows
(with Internet Explorer 5 and above)
·
Mac
(Panther OS X 10.3 and above – Safari-based)
·
Linux
GTK and Linux Motif: RedHat Enterprise Linux 3 and SuSE 9 should be fully
compliant, and some other Linux distributions may require a supported version
of Mozilla to be installed.
See the SWT
FAQ (http://www.eclipse.org/swt/faq.php)
to get more information about the supported platforms for SWT and its browser
widget.
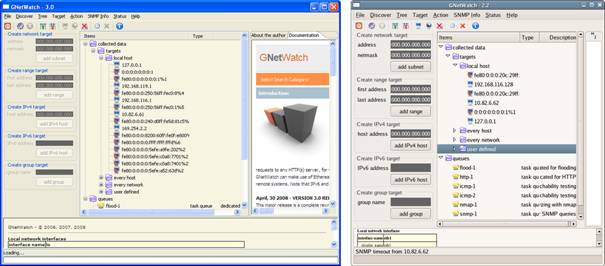
Figure 1 : GNetWatch on MS-Windows and
GNetWatch on Linux
2.1. Different ways to install GNetWatch
Here are several
ways to install GNetWatch:
·
download
a bundle (installation already
packaged) for Linux or MS-Windows
·
download
the GNetWatch JAR file and public domain dependant packages
·
download
the GNetWatch java sources archive and compile it
2.2. Using a bundle for MS-Windows
Just follow these steps:
1. download and install a Java SE Runtime Environment (JRE) compliant with JRE 5 specifications at least (available for instance from http://java.sun.com)
2. download and extract the GNetWatch MS-Windows bundle
3. double-click on gnetwatch.bat (see figure).
Until GNetWatch 2.2, you could run the program by double-clicking on the GNetWatchBundle.jar file. Starting with GNetWatch 3.0, avoid
double-clicking on GNetWatchBundle.jar because it may launch GNetWatch without setting a sufficient maximum heap
size, so the program may crash later if using an internal database. On the
contrary, gnetwatch.bat correctly sets the appropriate memory options.

2.3. Using a bundle for Linux
Just follow
these steps:
1. download and install a Java SE
Runtime Environment (JRE) compliant with JRE 5 specifications at least
(available for instance from http://java.sun.com)
2. download and extract the GNetWatch Linux bundle
3. set and export the MOZILLA_FIVE_HOME environment variable (see your Mozilla or Firefox documentation)
4. include the GNetWatch installation directory and the MOZILLA_FIVE_HOME in the LD_LIBRARY_PATH environment variable
5. invoke the Java VM
The figure “Figure 3 : running GNetWatch under Linux” gives an example of running under Linux.
user@host% tar zxf GNetWatch-LinuxBundle-version.tar.gz
user@host% cd GNetWatch-LinuxBundle-version
user@host% MOZILLA_FIVE_HOME=/usr/lib/mozilla-1.7.12
user@host% export MOZILLA_FIVE_HOME
user@host% LD_LIBRARY_PATH="$LD_LIBRARY_PATH:$MOZILLA_FIVE_HOME:."
user@host% export LD_LIBRARY_PATH
user@host% java -XX:+AggressiveHeap -jar GNetWatchBundle.jar
Figure 3 : running GNetWatch under
Linux
2.4. Running external programs
2.4.1. Standard programs
GNetWatch can
call NMap and Ethereal/Wireshark:
·
Ethereal/Wireshark
to track new hosts
·
NMap
to display information about remote hosts
Before
running GNetWatch, you must include nmap (or nmap.exe on MS-Windows) and tethereal (or tethereal.exe on MS-Windows) in the PATH. If you
installed Wireshark instead of Ethereal, you must rename or copy tshark (or tshark.exe on MS-Windows) to tethereal (or to tethereal.exe on MS-Windows).
2.4.2. Generic programs
GNetWatch
can also connect to external probes to monitor targets. This is done by running
external programs or tracking changes to file contents. This feature is
described later in this document.
3.1. Main configuration file: config.xml
The main
configuration file is named config.xml and is located in the GNetWatch installation base directory.
This file
contains Java configuration properties following this XML format:
<entry
key="CONFIGURATION_ENTRY">ENTRY_VALUE</entry>
Here are
the available configuration entries:
·
net.fenyo.log4j
This entry defines the
name of the logging engine configuration file.
·
net.fenyo.initialobjects
This entry defines the
name of a file that contains definitions of user-defined GNetWatch objects that
will be built just after GNetWatch start-up.
·
net.fenyo.genericconffile
This entry defines the
name of a file that contains definitions of generic templates used to connect
to external probes.
·
net.fenyo.queues.count.icmp
This entry defines the number
of queues that can simultaneously handle actions of type ActionPing.
·
net.fenyo.queues.count.snmp
This entry defines the number
of queues that can simultaneously handle actions of type ActionSNMP.
·
net.fenyo.queues.count.flood
This entry defines the number
of queues that can simultaneously handle actions of type ActionFlood.
·
net.fenyo.queues.count.http
This entry defines the number
of queues that can simultaneously handle actions of type ActionHTTP.
·
net.fenyo.queues.count.nmap
This entry defines the number
of queues that can simultaneously handle actions of type ActionNmap.
·
net.fenyo.queues.count.process
This entry defines the number
of queues that can simultaneously handle actions of type ActionGenericProcess.
·
net.fenyo.queues.count.source
This entry defines the number
of queues that can simultaneously handle actions of type ActionGenericSrc.
·
net.fenyo.nmap.timeout
This entry defines the timeout
in milliseconds used when waiting for Nmap sub-processes.
·
net.fenyo.ipaddresseditor.insertonkeypressed
This boolean entry
defines the type of Key events that are used by the IPv4 address editor of GNetWatch.
When running GNetWatch under SWT+GTK+X11, set it to false. Otherwise, set it to
true.
·
net.fenyo.ping.countparameter
Since JRE is not
efficient with raw sockets, GNetWatch starts external
·
net.fenyo.ping.regex
This entry defines
a regular expression used by GNetWatch to parse the output of
·
net.fenyo.language and net.fenyo.country
these entries are
used to set the desired LOCALE.
Here is a configuration file example for use with an English MS-Windows system:
<?xml
version="1.0" encoding="UTF-8" ?>
<!DOCTYPE
properties SYSTEM "http://java.sun.com/dtd/properties.dtd">
<properties>
<comment>General configuration
properties for MS-Windows</comment>
<entry
key="net.fenyo.log4j">log4j.xml</entry>
<entry
key="net.fenyo.initialobjects">initial-objects.xml</entry>
<entry
key="net.fenyo.genericconffile">generic.xml</entry>
<entry
key="net.fenyo.queues.count.icmp">2</entry>
<entry
key="net.fenyo.queues.count.snmp">2</entry>
<entry key="net.fenyo.queues.count.flood">1</entry>
<entry
key="net.fenyo.queues.count.http">1</entry>
<entry
key="net.fenyo.queues.count.nmap">1</entry>
<entry
key="net.fenyo.queues.count.process">1</entry>
<entry
key="net.fenyo.queues.count.source">1</entry>
<entry
key="net.fenyo.nmap.timeout">120000</entry>
<entry key="net.fenyo.ipaddresseditor.insertonkeypressed">true</entry>
<entry
key="net.fenyo.ping.countparameter">-n</entry>
<entry
key="net.fenyo.ping.regex">(.|\r|\n)*:.*?([0-9]+)[^0-9]*ms(.|\r|\n)*</entry>
<entry
key="net.fenyo.language"></entry>
<entry
key="net.fenyo.country"></entry>
</properties>
Here is a configuration file example for use
with a French Linux system:
<?xml
version="1.0" encoding="UTF-8" ?>
<!DOCTYPE
properties SYSTEM "http://java.sun.com/dtd/properties.dtd">
<properties>
<comment>General configuration
properties for Linux</comment>
<entry
key="net.fenyo.log4j">log4j.xml</entry>
<entry
key="net.fenyo.initialobjects">initial-objects.xml</entry>
<entry key="net.fenyo.genericconffile">generic.xml</entry>
<entry
key="net.fenyo.queues.count.icmp">2</entry>
<entry
key="net.fenyo.queues.count.snmp">2</entry>
<entry
key="net.fenyo.queues.count.flood">1</entry>
<entry
key="net.fenyo.queues.count.http">1</entry>
<entry
key="net.fenyo.queues.count.nmap">1</entry>
<entry
key="net.fenyo.queues.count.process">1</entry>
<entry
key="net.fenyo.queues.count.source">1</entry>
<entry
key="net.fenyo.nmap.timeout">120000</entry>
<entry
key="net.fenyo.ipaddresseditor.insertonkeypressed">false</entry>
<entry
key="net.fenyo.ping.countparameter">-c</entry>
<entry
key="net.fenyo.ping.regex">(.|\r|\n)*:.*?([0-9]+)\.[0-9]*[^0-9]*ms(.|\r|\n)*</entry>
<entry
key="net.fenyo.language">fr</entry>
<entry key="net.fenyo.country">FR</entry>
</properties>
The
following picture shows the same menu displayed under different localization
options.
Figure 4 : same menu with different locale
3.2. Creating objects at start-up
3.2.1. Defining objects
The file
defined in the net.fenyo.initialobjects configuration entry may be used to make
GNetWatch automatically build objects at start-up. Among the many objects GNetWatch
lets you build through the GUI, only a few target types with limited features
can be built through this file:
·
groups: trees of groups can be defined, meaning
parents of a group are groups.
·
IPv4 targets: parents of IPv4 targets must be groups. IPv4 targets can define
specific SNMP properties.
·
IPv6 targets: parents of IPv6 targets must be groups. IPv6 targets can not define any specific SNMP properties
(you need to use the GUI to define those properties).
·
IPv4 subnets: parents of IPv4 subnets must be groups.
·
IPv4 ranges: parents of IPv4 ranges must be groups.
3.2.2. Example
Here is an
example of such a configuration file:
<?xml
version="1.0" encoding="ISO-8859-1" ?>
<gnetwatch>
<objects>
<target targetType="group">
<name>fenyo.net</name>
</target>
<target targetType="group">
<name>sourceforge.net</name>
</target>
<target targetType="group">
<name>gnetwatch.sourceforge.net</name>
<parent
parentType="group">sourceforge.net</parent>
</target>
<target targetType="ipv4">
<address>66.35.250.209</address>
<parent
parentType="group">gnetwatch.sourceforge.net</parent>
</target>
<target targetType="group">
<name>gw.fenyo.net</name>
<parent
parentType="group">fenyo.net</parent>
</target>
<target targetType="ipv4">
<address>192.168.0.5</address>
<parent
parentType="group">gw.fenyo.net</parent>
</target>
<target targetType="ipv4">
<address>88.170.235.198</address>
<parent
parentType="group">gw.fenyo.net</parent>
<snmp><version>v2c</version><community>private</community></snmp>
</target>
<target targetType="group">
<name>sandbox</name>
<parent
parentType="group">gw.fenyo.net</parent>
<parent
parentType="group">www.sourceforge.net</parent>
<target targetType="ipv4">
<address>127.0.0.1</address>
<parent parentType="group">sandbox</parent>
</target>
</target>
</objects>
</gnetwatch>
The tree
structure corresponding to this file looks like:
- fenyo.net
-
gw.fenyo.net
-
192.168.0.5
- 88.170.235.198
-
sandbox
- 127.0.0.1
-
sourceforge.net
-
gnetwatch.sourceforge.net
-
66.35.250.209
-
sandbox (same instance as the previous one)
-
127.0.0.1
3.2.3. Defining SNMP parameters
Here is an
example of definition of the SNMPv1 properties:
<snmp>
<version>v1</version>
<community>public</community>
<pdu-max-size>1400</pdu-max-size>
<port>161</port>
<retries>3</retries>
</snmp>
Here is an
example of definition of the SNMPv2c properties:
<snmp>
<version>v2c</version>
<community>public</community>
<pdu-max-size>1400</pdu-max-size>
<port>161</port>
<retries>3</retries>
</snmp>
Here is an
example of definition of the SNMPv3 properties:
<snmp>
<version>v3</version>
<security>AUTH_PRIV</security>
<!-- use NOAUTH_NOPRIV to get no
authentication nor privacy,
AUTH_NOPRIV to get authentication
but no privacy
and AUTH_PRIV to get both
authentication and privacy -->
<password-auth>my_secret_for_authentication</password-auth>
<password-priv>my_secret_for_privacy</password-priv>
<pdu-max-size>1400</pdu-max-size>
<port>161</port>
<retries>3</retries>
</snmp>
3.3. Using an external database
Since
version 3.0, GNetWatch maintains its configuration and the collected data in a
JDBC compliant database. It is shipped with an embedded one: HSQLDB, but you
can configure an external database.
If you plan
to collect a big amount of data or track a lot of targets, you may encounter
memory and performance limitations using the internal HSQLB database. In that
case, migrate to an external database. You can choose any type of JDBC database
supported by Hibernate. The section “Database connection settings” in the file hibernate.cfg.xml defines the JDBC driver and
connection path to the database.
For
instance, to use an external HSQLDB process, apply the following steps:
1. run an external HSQLDB database
process with the following command:
java -XX:+AggressiveHeap -cp GNetWatchBundle.jar
org.hsqldb.Server
2. change the Database connection
settings in the file hibernate.cfg.xml like this:
<!--
Database connection settings -->
<property
name="connection.driver_class">org.hsqldb.jdbcDriver</property>
<property
name="connection.url">jdbc:hsqldb:hsql://127.0.0.1</property>
3. Finally, run GNetWatch.
3.4. Connecting to external probes
3.4.1. Defining templates
To connect
to external probes, you can choose between two ways:
·
external processes: GNetWatch can run an external
process and parse its numeric output as a probe value;
·
external sources: GNetWatch can also loop scanning a
file for new lines containing numeric output.
The file
defined in the net.fenyo.genericconfigfile configuration entry is used to easily define
standard tasks using external processes of files. The one shipped with
GNetWatch contains templates letting you probe remote CPU load and remote free
physical memory.
Each
template entry contains the following parameters:
·
name: the template name;
·
title: the name of the action associated with this
template entry;
·
unit: the unit associated with the numeric value
returned by this probe.
Templates
of type process also contain the
following parameters:
·
cmdline: the command line (process name and arguments);
·
workdir: the current working directory set by
GNetWatch before spawning the process.
Templates
of type source also contain the
following parameter:
·
filename: path of the file used to collect probed
numeric values.
3.4.2. Example
Here is an
example of such a configuration file:
<?xml version="1.0"
encoding="ISO-8859-1" ?>
<gnetwatch>
<generic>
<template type="source">
<name>external file</name>
<title>external file</title>
<filename>FILENAME</filename>
<workdir></workdir>
<unit></unit>
</template>
<template type="process">
<name>external process</name>
<title>external process</title>
<cmdline>COMMAND_LINE</cmdline>
<workdir></workdir>
<unit></unit>
</template>
<template type="process">
<name>MS-Windows target: processor load</name>
<title>processor load</title>
<cmdline>generic\procload.bat CPU0 remote_host user@domain
password</cmdline>
<unit>%</unit>
</template>
<template type="process">
<name>MS-Windows target: free physical memory</name>
<title>free physical memory</title>
<cmdline>generic\freephysmem.bat remote_host user@domain
password</cmdline>
<unit>kb</unit>
</template>
</generic>
</gnetwatch>
4.1. General concepts
The major GNetWatch
operations are based on the following 5 concepts: targets, actions, queues, events and views.
4.1.1. Targets
A target is
a persistent object on which you can perform operations. Some targets can also
be a container for other targets. For instance, a TargetIPv4Subnet instance is
a target container that holds sub-targets such as TargetIPv4 instances. Note
that we name “instance” any target of a specific type.
4.1.2. Actions
An action
is an object attached to a target and that can perform an operation on it.
Over-loading an HTTP server represented by a TargetIPv4 instance is a typical
action. There are currently seven action types:
·
ActionPing:
used to ping remote hosts;
·
ActionSNMP:
used to collect throughput of remote network interfaces;
·
ActionFlood:
used to flood UDP packets to remote targets;
·
ActionHTTP:
used to load a web or ftp server;
·
ActionNmap:
used to invoke NMap on a remote target;
·
ActionGenericProcess:
used to probe a remote value by spawning a sub-process;
·
ActionGenericSrc:
used to probe a remote value by scanning a file.
4.1.3. Queues
To perform
its operation, an action must be activated by a circular queue. A queue holds
several actions, and activates them one after the other. When every target has been
activated, this process loops. Each queue is processed by a dedicated thread so
that different queues can perform parallel actions. Each type of action is
processed by one or many dedicated queues.
4.1.4. Events
Ann event
maintains a time stamped piece of information relative to a specific target.
Events are created by actions when they perform their operations. The
round-trip-time to contact a host is a typical event.
4.1.5. Views
A view can
display many events associated to a single target in a human-readable form. For
instance, a view can generate a real-time graph that moves when new events are
created by a running action.
4.2. Main GUI
The figure
“Figure 5 : main window” highlights the nine main areas of the GUI.
1. Targets area:
this area displays a tree that contains the targets, the actions that perform
operations on them and the views used to display events attached to theses
targets. The elements inside this tree are named tree items.
2. Queues area:
this area displays a tree containing each queue. Since several queues of a same
type can be created for parallel processing, an index number is appended to the
queue type. For instance, the figure shows two queues named icmp-1 and icmp-2 meaning that two
3. Target creation area: on this area, you will find the targets that can be manually created.
when pressing the “add” button, the target is inserted as a child of the
current (i.e. selected) target in the Targets area.
4.
Menus area: the eight menus are used to
perform most operations, like managing the tree items, adding or removing
targets, views and actions, getting specific information or status, etc.
5.
Toolbar area: this area contains shortcuts for
some menu entries.
6.
Panel area: this area contains two persistent
panels (the About the author and the Documentation panels) and transient
panels created when double-clicking on a view. Each transient panel displays statistics
about the events associated with a view. To update a view panel, no need to
close and re-open it, just double-click on the view in the tree item.
7.
Status bar: the status bar displays the
current operation status. It is updated by actions.
8.
Progress bar: if a queue is selected in the
queues area, the progress bar displays a bar the progresses each time an action
in this queue is finished. The bar is fully expanded when every action is done.
If the queue is empty, the bar is hidden.
9.
Information panel: this panel contains textual
information that is added by some menu operations (ex.: the “Get system
description” submenu entry adds a description dealing with the currently
selected target at the end of the information panel).

Figure 5 : main window
4.3. Graph window
Each view
is associated with an information panel. Views relative to numeric events are
also associated with a graph window. These windows can display the numeric
values associated with events in two ways:
·
Automatic mode: the horizontal and vertical scales
are automatically adjusted and the window is continuously scrolled.
·
Manual mode: the user can drag the graph with
the mouse and he can also adjust the horizontal and vertical scales manually.
This mode appeared in version 3.0.
The figure
“Figure 6 : graph window” highlights the main elements of such a window :
1. Target name and
view name: these elements are
displayed in the window title.
2. Scale mode:
the user can switch from the initial automatic scale mode to the manual scale mode
by selecting the window and pressing any key or mouse button. To come back in
the automatic scale mode, the user must select the window and press the ‘a’
key.
3. Key bindings:
the top line of the window displays the major key bindings.
4. Mode: the
current mode is displayed on the left.
5. Events:
event values are displayed in red and a green line connects them.

Figure 6 : graph window
5.1. Introduction
This section
enumerates the steps you need to complete to achieve the following main
operations:
·
compute
the round-trip-time to reach a host
·
explore
throughput of remote interfaces using SNMP
·
invoke
NMap on a remote host
·
flood
a target with UDP
·
load
a web server with parallel connections
·
discover
hosts with Ethereal/WireShark
5.2. Compute the round-trip-time to reach a host
5.2.1. Starting operations
The ICMP
network protocol is used to compute the round-trip-time to reach a host. Since
the Java TCP/IP API is particularly not suitable to generate ICMP packets,
GNetWatch spawns an external program: ping. The program output is parsed to get
the delay and an event is generated to store the result in milliseconds.
The figure named
“Figure 7 : round-trip-time step-by-step” shows the different steps needed to monitor the
round-trip-time to a host have IP address 10.82.0.100 :
·
1st step: create a group
Since a node can have multiple addresses (for instance like a router), we first
create a group corresponding to our host: the addresses will be children of
this group. This type of management will help us organize easily a target tree
containing hundreds of items. So we choose a special target type that can
contain sub-targets: the group target. To create a new one, just click on the
item “user defined” in the targets area, type the name of the group in the left
panel for target creation named “create group target” (here we choose my router) and press the “add group” button.
·
2nd step: create a target
We now want to
create the IP target as a child of the group target, so we select the
newly-created group, we type the IP address 10.82.0.100 in the left panel for
target creation named “create IPv4 target” and finally press the “add IPv4
host” button.
·
3rd step: add an action
To regularly
compute a ping on this IP target, we need to insert an action in one of the
ICMP circular queues and associate it to the target. To do this, you first need
to select the IP target in the targets area. Then, in the Action menu, we select
the “
- the new action: the current RTT value
is updated on the same line of the action name (in the description column),
just after each ICMP packet is received;
- a new view named “up/down”: this
view appears just after the first event is created by the action and will stay
there as long as some ICMP events associated with this target will be stored in
the database. Since this view is associated with these events, removing the
view would drop the events.
·
4th step: browse the view
To browse the
events, we double-click on the view. It creates two objects:
- a new information panel: this panel
contains statistics about the events associated with this view. To update those
statistics, you need to double-click on the view again. If you removed this
panel, just double-click on the view to create it again;
- a new graph window: this graph
window displays the events associated with this view. It is automatically
updated when new events are created. Moreover, when in automatic mode, it is
automatically scaled and scrolled. If you close this window, just double-click
on the view to make it appear again.
5.2.2. Understanding the target tree
We created only
three items in the target area: an IP target, an ICMP action and a
1. Some targets are automatically created.
Each IP address of the node on which you run GNetWatch is automatically added
under “local host”. You will then probably find IP targets associated to your loopback
interface: an IPv4 target named “127.0.0.1” and IPv6 target named “::1”. You
will also find IP targets associated to you network interfaces. With our
example, we got an IPv4 target named “10.82.6.61” and a link-local IPv6 target
named “fe80:0:0:0:240:d0ff:fe5d:81c5%7”.
Each time an IPv4 target is added, a corresponding network target is added
under “every network”. For this reason, we got two network targets:
“127.0.0.0/255.0.0.0” and “10.0.0.0/255.0.0.0”.
2. Targets can have many parents: a target and its descendant tree of
children are displayed under each of its parents.
So, when we added the IPv4 target named “10.82.6.61” under the node “my
router”, the IPv4 target got three parents: the group target named “my router”
(because it was selected when we pressed “add IPv4 host”), the group target
named “every host” (because every IP target is a child of this group target),
the network target named “10.0.0.0/255.0.0.0” because this is the network
associated with IP address 10.82.6.61. For the same reason, we will find many
instances of the IP targets associated with loopback and other network
interfaces.
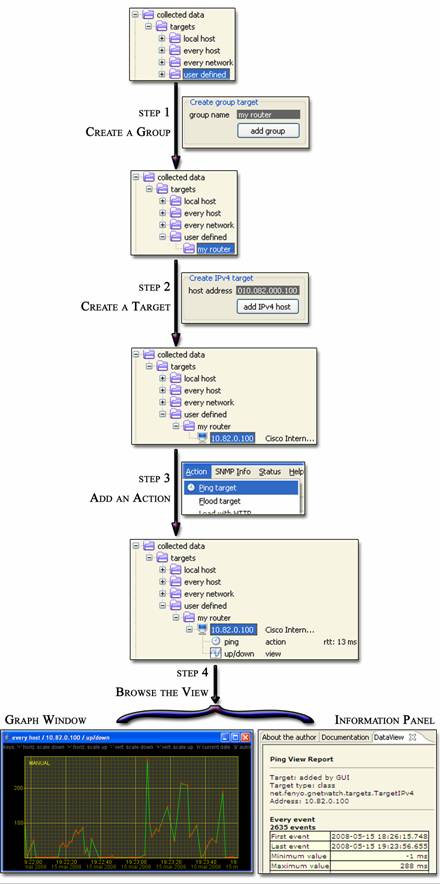
Figure 7 : round-trip-time step-by-step

Figure 8 : automatic target creation
5.2.3. Cancelling operations
To cancel the
operations we previously did, we need to delete actions, delete views and
associated events, and finally remove targets. There are many ways to perform this:
·
first way: one thing at a time
We first remove the action: click on
the action to select it and use the menu entry “Drop Action” in the “Action”
menu.
We can now remove the view: click on
the action to select it and use the menu entry “Drop View” in the “Action”
menu. This removes the view and associated events. If we had not previously
dropped the action, a new view would rapidly be created again because of the
new events instantiated by the action.
Then we can remove the IP target: click
on the IPv4 target item under “my router” to select it and use the menu entry
“Detach Element” in the “Target” menu. At this point, the IPv4 target is not
removed because you only detached it from one of its three parents. The two
remaining parents are the group target named “every host” and the network
target named “10.0.0.0/255.0.0.0”. So, you now need to detach the IP target
from the network target: click on the IPv4 target item under the network target
and repeat the process. The IP target is now definitively removed. It should
not be, since it previously had two parents and you detached it from one parent
only. The explanation is that just after you detached the IP target from its
network parent, there was finally only one parent: the “every host” group. For
the same reason a host is automatically added to this group at creation time,
it is automatically deleted when it has not any other parent.
Finally we can remove the group named “my
router”: click on the group to select it and use the menu entry “Detach
Element” in the “Target” menu. Everything is now removed.
·
second way: recursive removal
We first remove at once the group named
“my router”, the “ping” action, the view and the associated events: click
on the group named “my router” to select it and use the menu entry “Detach
Element” in the “Target” menu. This will recursively detach every target and
drop every action, view and associated events.
We finally need to remove the IP target:
for this to be done, we need to detach the IP target from the network target
named “10.0.0.0/255.0.0.0”: click on the IPv4 target item under the network
target and use the menu entry “Detach Element” in the “Target” menu.
5.3. Explore throughput of remote interfaces using SNMP
The figure
“Figure 9 :
explore via SNMP” describes step-by-step the process of using SNMP to
explore a host and get throughput of its remote interfaces.

Figure 9 : explore via SNMP
The SNMP
credentials are associated with the IP target: you need to set them before
adding the SNMP action. Use the menu entry “Set Credentials…” in the “Target”
menu to open the credentials dialog. Then choose the appropriate SNMP dialect: SNMPv1,
SNMPv2c, SNMPv3 (MD5 + DES).
You will
notice a new type of target: interfaces. The first time the SNMP action is
invoked by an SNMP queue, it queries the interface list of its parent IP target
through SNMP. For each remote interface, it creates an interface target. Then,
each time the SNMP action is invoked, it updates the ingress and egress
throughput of the interfaces.
With this
process, if you remove an interface, it will not be automatically added the
next time the action is invoked. You need to drop the action and create it
again if you want the interface to appear again.
5.4. Invoke NMap on a remote host
To invoke
NMap on a remote host, just create an IP target, select it and choose the menu
entry named “Explore via Nmap” in the “Action” menu. It will add an action that
will invoke nmap, create a view with the results and finally remove itself from
the NMap queue. To display the results, double-click on the view: the
information panel will contain the results.
5.5. Flood a target with UDP
GNetWatch can flood packets with any DiffServ
codepoint (DSCP/ToS), especially those defined in RFC-2597 (Assured Forwarding
Per Hop Behaviour Group) and RFC-2598 (Expedite Forwarding Per Hop Behaviour
Group). This is very useful when troubleshooting QoS in IP networks.
Use the menu entry “Set IP options…” in the
“Target” menu to open the IP options dialog (see figure). Then select the correct DSCP or ToS, and set the other network parameters (UDP source
and destination ports and packet size).

5.6. Load a Web or Ftp server with parallel connections
GNetWatch
can load a Web or an FTP server with multiple parallel connections. Use the
menu entry “Set HTTP/FTP options…” in the “Target” menu to open the HTTP/FTP dialog
and set the URL (http, https and ftp URL schemes are supported), the proxy and
the number of parallel sessions. Then add an HTTP action, that will create two
views: the former to monitor the generated throughput in bit/s and the latter to
monitor the same throughput in pages/sec.

Figure
11 : loading a Web/Ftp
server with parallel connections
5.7. Discover hosts with Ethereal/WireShark
GNetWatch
can automatically discover new hosts by snooping on every network interface at
the same time. One Ethereal/WireShark command line process is spawned for each
interface when you use the menu entry named “Start” in the “Discover” menu.
Each new IP address discovered is automatically added in the tree under the
group named “every host” and the corresponding network is added under “every
network”. You may run ping broadcasts to automatically add every host on a
local or remote network. To stop every snooping process, use the menu entry
named “Stop” in the “Discover” menu.
6.1. Introduction
Generic
probes refer to collecting external numeric values to create events. GNetWatch
offers two ways to collect external numeric values:
·
spawning sub-processes: this is achieved with a generic
process action;
·
scanning files: this is achieved with a generic
source action.
6.2. Configure a target for generic probe
The only targets that can handle generic probes
are group targets.
A single group target can only be associated with one generic process action
and one generic source action. So, you must create several group targets to
collect several probes, even if they scan the same remote host.
To select
the parameters of the generic probe, you must select a group target and use the
menu entry named “Set generic options…” in the “Target” menu. Then you will see
a dialog box named “Generic options”. You can now directly fill the fields as
you like, or select a template. If you select a template, the fields will be
automatically filled with default values. Then you must customize the fields (hostname,
user name, password, etc.).
The figure named
“Figure 12 :
using a generic probe template” shows the default values that appeared just after
having selected a template.

Figure 12 : using a generic probe template
If you want
to spawn a sub-process, you do not need to fill the “file name” field. On the
contrary, if you want to scan a file, you do not need to fill the “command
line” and “working directory” fields.
6.3. Spawning sub-processes
In order to
spawn a sub-process, you need to select the target group and add a “Generic
Process” action with the corresponding entry in the “Action” menu. The program
name at the beginning of the command line field must be an absolute path or a
path relative to the GNetWatch installation base directory. The program must only return a positive
integer.
6.4. Scanning files
In order to
scan a file, you need to select the target group and add a “Generic Source”
action with the corresponding entry in the “Action” menu. The file name field
must contain an absolute path or a path relative to the GNetWatch installation
base directory. New values can only be
positive integers and must be appended to the end of the file.
6.5. Available templates
GNetWatch
is shipped with 4 generic probe templates:
·
remote MS-Windows processor load: this template is based on a Visual
Basic script that uses WMI (Windows Management Instrumentation) to collect a
remote processor load. On the command line, change CPU0 to CPUx to collect the
load of CPU number x. You also need to specify the domain/login/password of an
account that has sufficient rights to make WMI calls to the remote server.
·
remote MS-Windows free physical
memory: this
template is based on a Visual Basic script that uses WMI (Windows Management
Instrumentation) to collect the amount of remote free physical memory available.
You also need to specify the domain/login/password of an account that has
sufficient rights to make WMI calls to the remote server.
·
remote Unix/Linux processor load: this template is based on a script
that uses ssh and uptime to get the remote processor load. Note that you must
have configured ssh to accept remote commands without any password (for
instance, create a couple of DSA keys on the local host and add the public one
to the authorized keys list on the remote host).
·
remote Unix/Linux free physical
memory: this
template is based on a script that uses ssh and /proc/meminfo to get the amount
of remote physical memory available. Note that you must have configured ssh to
accept remote commands without any password (for instance, create a couple of
DSA keys on the local host and add the public one to the authorized keys list
on the remote host).
Note that the remote MS-Windows
templates are only available with the MS-Windows GNetWatch bundle, and that the
remote Unix/Linux templates are only available with the Linux GNetWatch bundle.
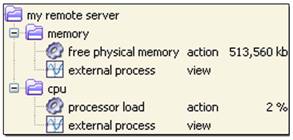
6.6. Example
In this
example, we want to collect the free physical memory and the processor load of a
single remote system. Since a group target can only be associated with one
generic process action, we create the three following group targets:
1. my remote server: this group represents the remote system;
2. memory: this
group is a child of my remote server, and will be used to get the free physical
memory. So, we select this group and use the menu “Set generic options…” to set
the free physical memory template. Then we add a generic process action on this
group.
3. cpu: this
group is a child of my remote server, and will be used to get the processor
load. So, we select this group and use the menu “Set generic options…” to set
the cpu load template. Then we add a generic process action on this group.
The figure shows
the resulting tree item.
7.1. UML class diagram
The UML classes
diagram of GNetWatch show the relationships between the different types of
Targets, Actions, Queues, Events and Views. The figure “Figure 14 : UML classes diagram” shows the classes diagram of GNetWatch 2.2.
7.2. Sources
The sources
are available on http://www.gnetwatch.com
7.3. Locks
Managing
locks is a complex work inside GNetWatch, since many actions may run at the
same time in different threads, and since all of them may modify internal data
and external DB content.
When
possible, GNetWatch wraps thread-unsafe collections with synchronized wrappers,
like Collection.synchronizedMap() and Collection.synchronizedList().
Otherwise,
objects are used to synchronize threads. Here is a list of synchronized objects
and classes :
·
GUI.tab_folder (global lock)
·
GUI.GUI_created (global
lock)
·
GUI.sync_tree (global lock)
·
synchro
(global lock)
·
ExternalCommand
(instances)
·
CaptureManager
(global lock)
·
CaptureManager.capture_list
(global lock)
·
CaptureManager.listeners
(global lock)
·
Queue
(instances)
·
Queue.actions
(instances)
·
AwtGUI.frame_list
(instances)
·
BasicComponent.sync_value_per_vinterval
(instances)
·
BasicComponent.sync_update
(instances)
·
BasicComponent.events
(instances)
·
VisualElement.initialized
(instances)
·
SNMPQuerier.getSysDescr()::invoked
(instance)
·
registered_components
(instance)
7.4. Threads
Many thread
groups run inside the GNetWatch process, as you can see in table “Table 1 :
threads”.
|
thread |
Origin |
|
main |
CommandLine.main() |
|
interrupt |
Background.run() |
|
GUI |
GUI.run() |
|
capture-* |
Capture.run() |
|
repaint |
AwtGUI.run() |
|
icmp-* |
PingQueue.run() |
|
snmp-* |
SNMPQueue.run() |
|
flood-* |
FloodQueue.run() |
|
http-* |
HTTPQueue.run() |
|
generic-process-* |
GenericProcessQueue.run() |
|
generic-source-* |
GenericSrcQueue.run() |
|
nmap-* |
NmapQueue.run() |
|
hsqldb |
library
thread (HSQLDB) |
|
DefaultUDPTransportMapping |
library
thread (SNMP4J) |
|
Timer-0 |
system thread |
Table 1 : threads
